August 17, 2011 Performance, WCF
If you are lazy to read whole post, jump to “Summary”.
Have you been in situation when a project was designed for low performance needs and in the end of the day customers want it to be 100 times faster? You have to be ready for such time and be ready to scale.
We changed the configuration of our application for more aggressive processing but it did not meet customer needs, so we had to do much more other tweaks to make our service performing better. Unfortunately along with with improvements we started to get memory leaks.
So our app started to eat memory dramatically. Within 5-15 minutes it was already hitting 2Gb score. Why the hell? Most of the changes were configuration and performance tweaks.
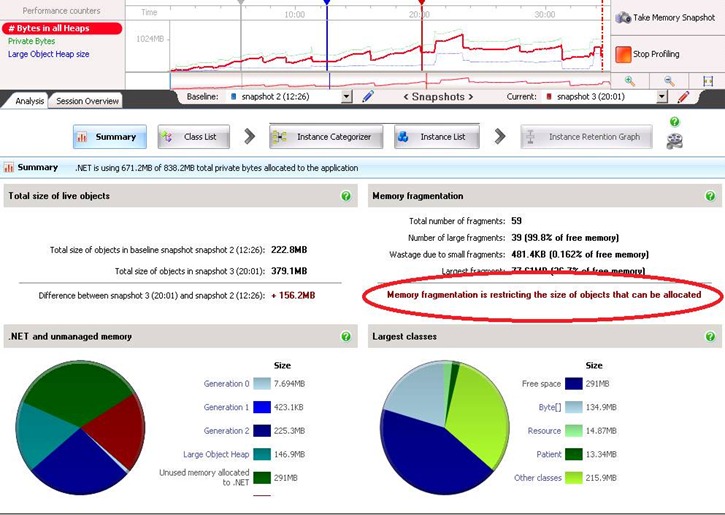
I decided to profile the application with ANTS Memory Profiler. (by the way it is simply amazing profiler). After I learned what means what in the profiler, I was able to analyze what I see. Turns out our application produces huge memory fragmentation with large objects. (see screenshots below)
Here are some recommendations for fixing such issues from profiler website:
Solving large object heap fragmentation
Large object heap fragmentation can be one of the most difficult types of memory problem to solve, because it often involves changes to the architecture of the application. The best approach to use will depend on the exact nature of your program:
•Split arrays into smaller units so that they remain below 85kB (and so are never allocated on the large object heap).
•Alternatively, you can allocate the largest and longest-living objects first (if your objects are files which are queued for processing, for example).
•In some cases, it may be that periodically stopping and restarting the program is the only option.
So what are these large objects? My initial thought was that out app simply was not keeping up with processing and we overloaded memory with many large collections that were not garbage collected.
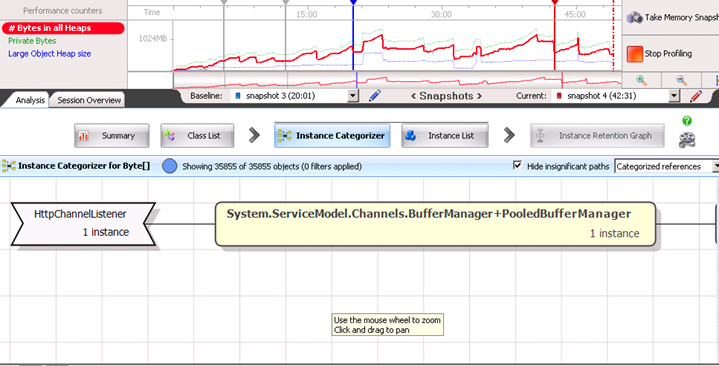
But what was interesting was this funny Byte[] array keeping 134Mb of memory… I drilled deeper and found the following:
Oh, System.ServiceModel.Channels.BufferManager! This made me thinks that large objects are actually allocated by WCF and never disposed, so in the end of the day it was causing our memory leaks.
So I knew that it is something related to WCF BufferManager. I started looking at what was changed in WCF configuration in order to process bigger messages. Here is what I found:
<binding name=”Allscripts.Homecare.WSHTTPBinding.Configuration” closeTimeout=”00:05:00″ openTimeout=”00:05:00″ receiveTimeout=”00:10:00″ sendTimeout=”00:05:00″ maxBufferPoolSize=”2147483647″ maxReceivedMessageSize=”2147483647″>
<readerQuotas maxDepth=”2147483647″ maxStringContentLength=”2147483647″ maxArrayLength=”2147483647″ maxBytesPerRead=”2147483647″ maxNameTableCharCount=”2147483647″/>
Do you see anything interesting about the configuration above? Yes, all values are set to max. What are chances that someone really evaluated their impact on performance before setting everything to max? Max is always better. Isn’t it? maxBufferPoolSize property is related to BufferManager. A bit of a search and I found this:
From http://kennyw.com/work/indigo/51 :
“On the built-in WCF Bindings and Transport Binding Elements, we expose MaxBufferPoolSize as a property for you to control our cache footprint. If you are sending small (< 64K) messages, then the default value of 512K is likely acceptable. For larger messages, it’s often best to avoid pooling altogether, which you can accomplish by setting MaxBufferPoolSize=0. You should of course profile your code under different values to determine the settings that will be optimal for your application.”
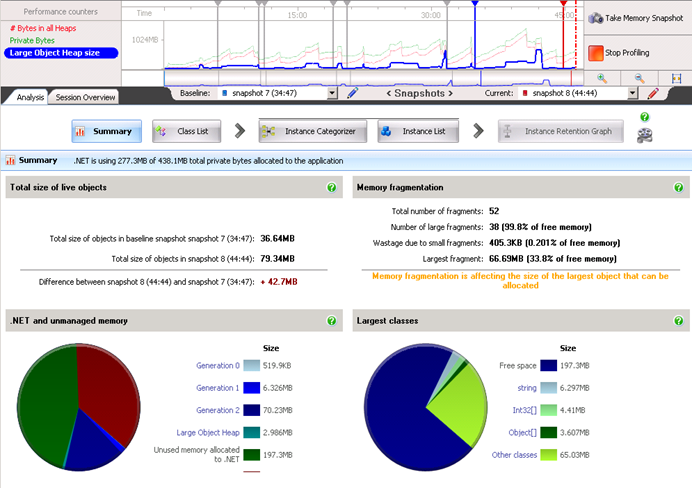
So with changing maxBufferPoolSize to 0 I was able to witness stability in the work of our service. Of course, it was still consuming some memory because of hard time we gave it, but it was not leaking.
From the picture below you can see that there is no problem with Large Objects Heap. It was nicely bumping up and down (blue line).
Summary
If you have performance problems, and try to fix them by changing all configuration parameters (timeouts, buffer sizes, other stuff) do this carefully. Always evaluate the performance impact. If you already have problems, use advanced profilers.
Surprisingly, increasing WCF maxBufferPoolSize doesn’t always mean increase in performance, rather it can result in huge memory leaks if the size of your messages is larger than 64K. For larger messages it is better to set MaxBufferPoolSize=0. For me it sounds like GC is not so keen on disposing large objects from heap and this caused our issues.
Hope this helps someone.
9 comments
| Markdown | Result |
|---|---|
| *text* | text |
| **text** | text |
| ***text*** | text |
| `code` | code |
| ~~~ more code ~~~~ |
more code |
| [Link](https://www.example.com) | Link |
| * Listitem |
|
| > Quote | Quote |


Good post thanks
Thanks!
thank you very much!! it helped us a lot!! =)
Great! I'm really glad it helped.
Hi, when I read your post and some other ones, I thought that reducing the pool size is the solution. Using ANTS, I also noticed that GC could not collect byte[] due to poolBufferManager. However, when I reduced it to 1 (0 was not allowed), I went from "No issues with large object heap fragmentation was detected" to "Memory fragmentation may be causing .Net to reserve too much memory". Under Largest class group in the Ant's summary, free space increased and byte[] decreased and under ".Net and unmanaged memory", unused memory allocated to .Net increased.
Good, good, good, you saved my memory :)
Tanx a lot
Thanks a ton! It saved a great deal of time for us!
Thanks for this. It helped my team locate a memory issue within our WCF system.