October 5, 2015 .NET, Performance, VS No comments
Load Test use case requiring plugins and synchronous runs for same data
Load testing is a great way of finding out if there are any performance issues with your application. If you don’t know what a load test in VS is, please read this detailed article on MSND on how to use it.
What we want to load test
I have experience with creating load tests for high load web services in entertainment industry. At the moment I’m working on internal web application in which users exclusively “check out” and “check in” big sets of data (I will call them “reports” here). In this post I want to describe one specific use case for load testing.
In our application only one user can work at a time with a particular report. Because of this, load tests cannot be utilizing simulation of multiple users for same data. Basically, for one particular user and report, testing has to be synchronous. User finds a report, checks it out, checks it in and so on for the same report. We want to create multiple such scenarios and run them in parallel simulating same user working on different sets of data. Can be extended to really simulate multiple users if we implement some windows impersonation as well.
There are other requirements to this performance testing. We want to quickly switch web server we are running this tests against. This also means that database will be different, therefore we cannot supply requests with hardcoded data.
My solution
I’ve started with creating a first web performance test using web browser recording. It records all requests with the server in IE add-on. I recorded one scenario.
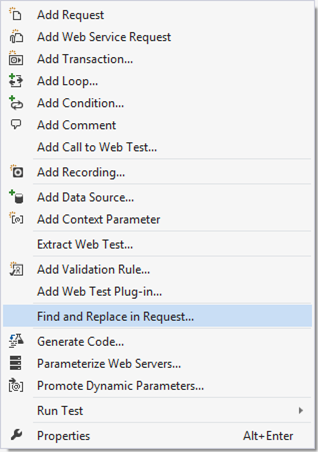
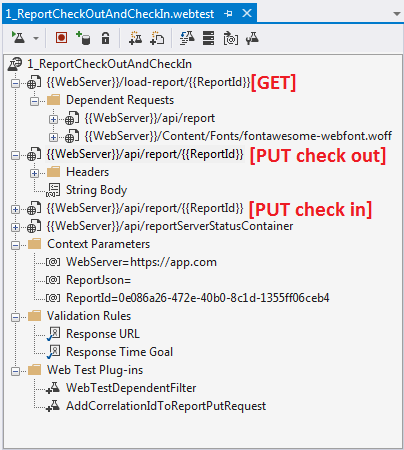
Depending on your application you might get a lot of requests recorded. I only left those that are most important and time consuming. One of the first things you want to do is to “Parameterize Web Servers…”. This will extract your server name into separate “Context Parameter” which you can later easily change. Also in my case, most of the requests are report specific, so I added another parameter called “ReportId” and then used “Find and Replace in Request…” to replace concrete id with “{{ReportId}}” parameter.
Recorder obviously records everything “as is” by embedding concrete report’s json into “String Body”. I want to avoid this by extracting “ReportJson” into a parameter and then using it in PUT requests. You can do this using “Add Extraction Rule…” on GET request and specify that you want to save response into a parameter. Now you can use “{{ReportJson}}” in String Body of put requests. As simple as that.
Unfortunately, not everything is that straight forward. When our application does a PUT request it generates a correlationId that is later used to update client on the processing progress. To do custom actions you can write plugins. I’ve added two of them. One is basically to skip some of the dependant requests (you can use similar to skip requests to external systems referenced from you page).
The other plug-in I’ve implemented is to take parameter “ReportJson” and update it with new generated correlationId. Here it is:
using System;
using Microsoft.VisualStudio.TestTools.WebTesting;

namespace YourAppLoadTesting
{
    public class AddCorrelationIdToReportPutRequest: WebTestPlugin
    {
        public string ApplyToRequestsThatContain { get; set; }

        public string BodyStringParam { get; set; }

        public override void PreRequest(object sender, PreRequestEventArgs e)
        {
            if (e.Request.Url.Contains(ApplyToRequestsThatContain) && e.Request.Method == "PUT")
            {
                var requestBody = new StringHttpBody();
                requestBody.ContentType = "application/json; charset=utf-8";
                requestBody.InsertByteOrderMark = false;
                requestBody.BodyString = e.WebTest.Context[BodyStringParam].ToString()
                    .Replace("\"correlationId\":null",
                        string.Format("\"correlationId\":\"{0}\\\\0\"", Guid.NewGuid()));
                e.Request.Body = requestBody;
            }
            base.PreRequest(sender, e);
        }
    }
}
In pluging configuration I set ApplyToRequestsThatContains to “api/report” and also BodyStringParam to “ReportJson”.
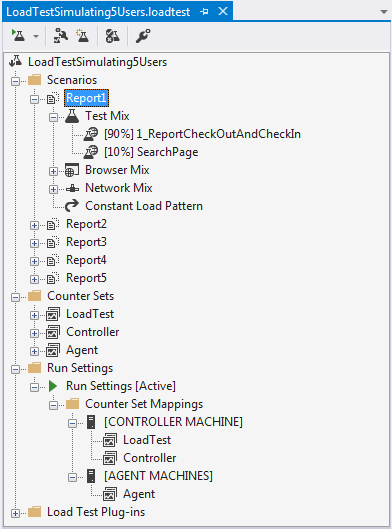
To finish with my load test all I had to do is to copy-paste few of this webtests and change ReportIds. After that I added webtests to a load test as separate scenarios making sure that every scenario has constant load of only 1 user. This makes sure that each scenario runs synchronous operations on individual reports.
I was actually very surprised how flexible and extensive load tests in VS are. You can even generate code from your webtest to have complete control over your requests. At least I would recommend you to generate code at least once to understand what it does under the hood.
I hope this helps someone.
WCF Configuration caused memory ‘leaks’
August 17, 2011 Performance, WCF 10 comments
If you are lazy to read whole post, jump to “Summary”.
Have you been in situation when a project was designed for low performance needs and in the end of the day customers want it to be 100 times faster? You have to be ready for such time and be ready to scale.
We changed the configuration of our application for more aggressive processing but it did not meet customer needs, so we had to do much more other tweaks to make our service performing better. Unfortunately along with with improvements we started to get memory leaks.
So our app started to eat memory dramatically. Within 5-15 minutes it was already hitting 2Gb score. Why the hell? Most of the changes were configuration and performance tweaks.
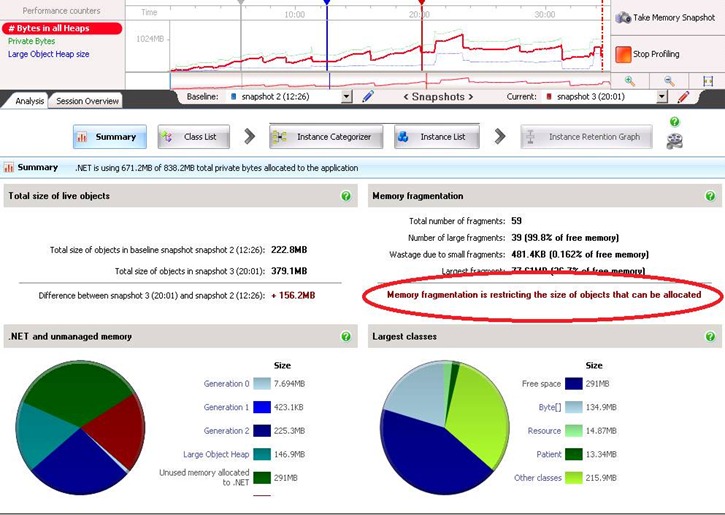
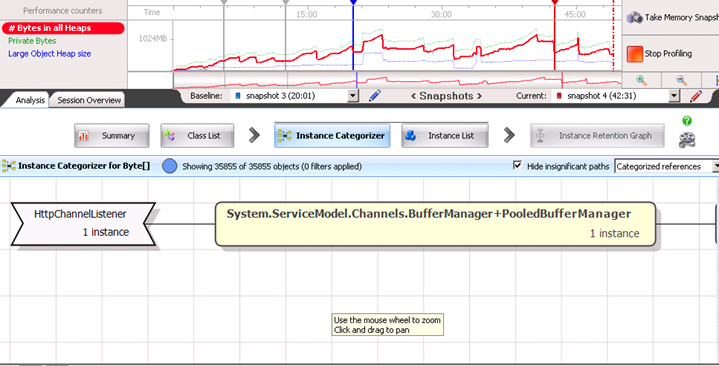
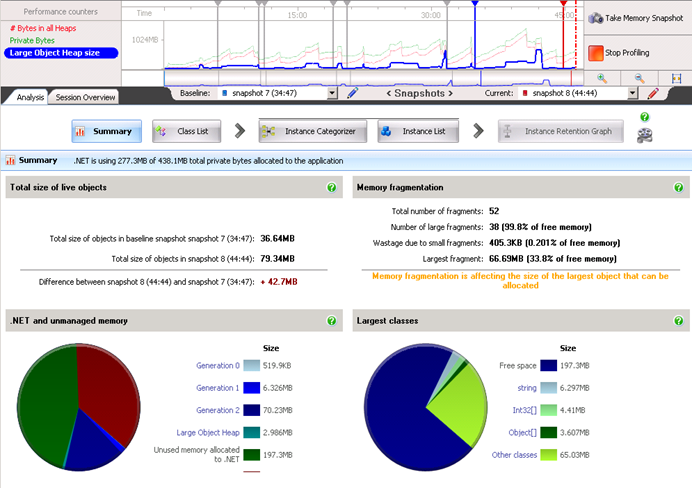
I decided to profile the application with ANTS Memory Profiler. (by the way it is simply amazing profiler). After I learned what means what in the profiler, I was able to analyze what I see. Turns out our application produces huge memory fragmentation with large objects. (see screenshots below)
Here are some recommendations for fixing such issues from profiler website:
Solving large object heap fragmentation
Large object heap fragmentation can be one of the most difficult types of memory problem to solve, because it often involves changes to the architecture of the application. The best approach to use will depend on the exact nature of your program:
•Split arrays into smaller units so that they remain below 85kB (and so are never allocated on the large object heap).
•Alternatively, you can allocate the largest and longest-living objects first (if your objects are files which are queued for processing, for example).
•In some cases, it may be that periodically stopping and restarting the program is the only option.
So what are these large objects? My initial thought was that out app simply was not keeping up with processing and we overloaded memory with many large collections that were not garbage collected.
But what was interesting was this funny Byte[] array keeping 134Mb of memory… I drilled deeper and found the following:
Oh, System.ServiceModel.Channels.BufferManager! This made me thinks that large objects are actually allocated by WCF and never disposed, so in the end of the day it was causing our memory leaks.
So I knew that it is something related to WCF BufferManager. I started looking at what was changed in WCF configuration in order to process bigger messages. Here is what I found:
<binding name=”Allscripts.Homecare.WSHTTPBinding.Configuration” closeTimeout=”00:05:00″ openTimeout=”00:05:00″ receiveTimeout=”00:10:00″ sendTimeout=”00:05:00″ maxBufferPoolSize=”2147483647″ maxReceivedMessageSize=”2147483647″>
<readerQuotas maxDepth=”2147483647″ maxStringContentLength=”2147483647″ maxArrayLength=”2147483647″ maxBytesPerRead=”2147483647″ maxNameTableCharCount=”2147483647″/>
Do you see anything interesting about the configuration above? Yes, all values are set to max. What are chances that someone really evaluated their impact on performance before setting everything to max? Max is always better. Isn’t it? maxBufferPoolSize property is related to BufferManager. A bit of a search and I found this:
From http://kennyw.com/work/indigo/51 :
“On the built-in WCF Bindings and Transport Binding Elements, we expose MaxBufferPoolSize as a property for you to control our cache footprint. If you are sending small (< 64K) messages, then the default value of 512K is likely acceptable. For larger messages, it’s often best to avoid pooling altogether, which you can accomplish by setting MaxBufferPoolSize=0. You should of course profile your code under different values to determine the settings that will be optimal for your application.”
So with changing maxBufferPoolSize to 0 I was able to witness stability in the work of our service. Of course, it was still consuming some memory because of hard time we gave it, but it was not leaking.
From the picture below you can see that there is no problem with Large Objects Heap. It was nicely bumping up and down (blue line).
Summary
If you have performance problems, and try to fix them by changing all configuration parameters (timeouts, buffer sizes, other stuff) do this carefully. Always evaluate the performance impact. If you already have problems, use advanced profilers.
Surprisingly, increasing WCF maxBufferPoolSize doesn’t always mean increase in performance, rather it can result in huge memory leaks if the size of your messages is larger than 64K. For larger messages it is better to set MaxBufferPoolSize=0. For me it sounds like GC is not so keen on disposing large objects from heap and this caused our issues.
Hope this helps someone.
Threading.Timer vs. Timers.Timer
June 9, 2010 .NET, C#, Concurrency, Performance 6 comments
I agree that title doesn’t promise a lot of interesting stuff at first glance especially for experienced .net developers. But unless you encounter some issue due to incorrect usage of timers you will never think that root is in timers.
System.Threading.Timer vs. System.Windows.Forms.Timer
In few words what are differences between Threading and Forms timers just to start with something.
System.Threading.Timer executes some method on periodic bases. But what is interesting is that execution of method is performed in separate thread taken from ThreadPool. In other words it calls QueueUserWorkItem somewhere internally for your method at specified intervals.
System.Windows.Forms.Timer ensure as that execution of our method will be in the same thread where we’ve created timer.
What if operation takes longer than period?
Let’s now think what will happen if the operation we set for execution takes longer than interval.
When I have following code:
my application behaves well – prints “a” twice a second. I took a look for number of threads in Task Manager and it stays constantly (7 threads).
Let now change following line: Thread.Sleep(500) to Thread.Sleep(8000). What will happen now? Just think before continue to read.
I’m almost completely sure that you predicted printing “a” every second after 8 seconds have passed. As you already guessed each of the “a” printings are scheduled in separate threads allocated from ThreadPool. So… amount of threads is constantly increasing… (Every 1.125 seconds :) )
Issue I’ve been investigating
Some mister X also figured out that Console.WriteLine(“a”) is critical and should run in one thread, at least because he is not sure how much does it take to execute Thread.Sleep(500). To ensure it will run in one thread he decided to have lock, like in code below:
Yes, this code ensures that section under lock is executed in one thread. And you know this code works well unless your execution takes few hours and you will be out of threads and out of memory. :) So that is an issue I’ve been investigating.
My first idea was System.Windows.Forms.Timer
My first idea was to change this timer to the System.Windows.Forms.Timer, and it worked well in application, but that application is able to run in GUI and WinService modes. But there are so many complains over interned to do not use Forms.Timer for non UI stuff. Also if you put Forms.Timer into your console application it will simply not work.
Why System.Timers.Timer is good toy?
System.Timers.Timer is just wrapper over System.Threading.Timer, but what is very interesting is that it provides us with more developer-friendly abilities like enabling and disabling it.
My final decision which fixes issue is to disable timer when we are diving into our operation and enable on exit. In my app timer executes every 30 seconds so this could not be a problem. Fix looks like:
timer.Enabled = false;
timer.Enabled = true;
And it looks that we don’t need lock there, but I left it there just to be sure is case if SomeOperation will be called from dozen of other threads.
MAKE DECISION ON TIMER BASING ON THIS TABLE (from msdn article)
| System.Windows.Forms | System.Timers | System.Threading | |
|---|---|---|---|
| Timer event runs on what thread? | UI thread | UI or worker thread | Worker thread |
| Instances are thread safe? | No | Yes | No |
| Familiar/intuitive object model? | Yes | Yes | No |
| Requires Windows Forms? | Yes | No | No |
| Metronome-quality beat? | No | Yes* | Yes* |
| Timer event supports state object? | No | No | Yes |
| Initial timer event can be scheduled? | No | No | Yes |
| Class supports inheritance? | Yes | Yes | No |
| * Depending on the availability of system resources (for example, worker threads | |||
I hope my story is useful and when you will be searching like “C# Timer Threads issues” or “Allocation of threads when using timer” you will find my article and it will help you.
Few threading performance tips I’ve learnt in recent time
May 16, 2010 .NET, Concurrency, MasterDiploma, Performance 4 comments
In recent time I was interacted with multithreading in .NET.
One of the intersting aspects of it is performance. Most of books says that we should not overplay with performance, because we could introduce ugly-super-not-catching bug. But since I’m using multithreading for my educational purposes I allow myself play with this.
Here is some list of performance tips that I’ve used:
1. UnsafeQueueUserWorkItem is faster than QueueUserWorkItem
Difference is in verification of Security Privileges. Unsafe version doesn’t care about privileges of calling code and runs everything in its own privileges scope.
2. Ensure that you don’t have redundant logic for scheduling your threads.
In my algorithm I have dozen of iterations on each of them I perform calculations on long list. So in order to make this paralleled I was dividing this list like [a|b|c|…]. My problem was in recalculating bounds on each iteration, but since list is always of the same size I could have calculating bounds once. So just ensure that don’t have such crap in your code.
3. Do not pass huge objects into your workers.
If you are using delegate ParameterizedThreadStart and pass lot of information with your param object it could decrease your performance. Slightly, but could. To avoid this you could put such information into some fields of the object that contains method for threading.
4. Ensure that you main thread is also busy guy!
I had this piece of code:
(int i = 0; i < GridGroups;
i++)
{
ThreadPool.UnsafeQueueUserWorkItem(AsynchronousFindBestMatchingNeuron,
i);
}
for (int i = 0; i < GridGroups;
i++) DoneEvents[i].WaitOne();
Do you see where I have performance gap? Answer is in utilizing my main thread. Currently it is only scheduling some number of threads (GridGroups) to do some work and than it waits for them to accomplish. If we divide work to approximately equivalent partitions, we could gave some work to our main thread, and in this way waiting time will be eliminated.
Following code gives us persormance increase:
(int i = 1; i < GridGroups;
i++)
{
ThreadPool.UnsafeQueueUserWorkItem(AsynchronousFindBestMatchingNeuron,
i);
}
AsynchronousFindBestMatchingNeuron(0);
for (int i = 1; i < GridGroups;
i++) DoneEvents[i].WaitOne();
5. ThreadPool and .NET Framework 4.0
Guys, from Microsoft improved performance of the ThreadPool significantly! I just changed target framework of my project to the .Net 4.0 and for worst cases in my app got 1.5x time improvement.
What’s next?
Looking forward that I also could create more sophisticated synchronization with Monitor.Pulse() and Monitor.WaitOne().
Good Threading Reference
Btw: I read this quick book Threading in C#. It is very good reference if you would like to remind threading in C# and to find some good tips on sync approaches.
P.S. If someone is interested if I woke up at 8am. (See my previous post). I need to say that I failed that attempt. I woke at 12pm.
I love Performance Profiler
March 14, 2010 IDE, Performance 2 comments
Honestly I haven’t used any Performance Profiler, since I did not feel need to use it and also I thought that it could be boring… How was I wrong! It is so easy and intuitive, I’m getting super good reports with highlighting of expensive code and it keeps highlighting in Visual Studio. So I’m always aware which code is expensive.
Take a look:
I love it.
