Rather than starting this blog post with first excusing about me being not much into IIS. I will share very simple but extremely powerful toolset to be aware how your web application is living its life.
Of course any good application has exception handling and logging in place therefor you know when “shit happens” and possibly able to dig into it, find root cause and fix. Great! But what if you want to know more? What if you want to see some graphics showing distribution of users, their favourite features, pick hours, etc? To some extend Google Analytics could satisfy your needs. I use it for this blog and it is absolutely brilliant there.
You could have better tool in your hands? Plain simple. Plain power.
First. Enable your IIS Logging
To enable IIS logging use this boring step-by-step explanation. Or find this self-explanatory nice pictogram
in IIS manager. After enabling it in actions section your logs will be collected accordingly to configuration. (Say for application with high load you might want to change configuration to generate a new log file for each hour.)
Second. Analyse what’s inside
Well, first step could be considered as waste of keystrokes for some of you as you find it natural to have IIS logging enabled. But I also know that there are applications running for which no one ever collected any logs and have only preliminary idea how their applications are used and what is happening at all.
Here is bit of my story: We develop HTTP API used by various front-ends. Now we rewrite one of our heavily used endpoints. Therefor it was needed to know usage patterns (GET method parameters) and picks. I was able to quickly find everything out. The most time consuming was to download all those gigs of logs. But as soon as they are easily accessible, everything is piece of cake. Just continue reading…
You would need some tool to start analysing your logs.
Best fit would be Microsoft LogParser. Download it. It is console application which allows to query stuff with SQL-like queries. I said “stuff” because it is not only logs. Have a look on this LogParser architecture diagram:
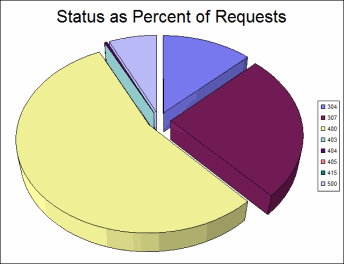
Output could be also charts (though there is dependency on MsOffice). For example this could be chart of non-200 status codes:
You can utilize this to to build nice reporting system with graphics to be sent to development team and/or managers.
Log Parser Studio
What if you want to quickly analyse something without bothering with console app?
There is Log Parser Studio – an excellent and handy tool.
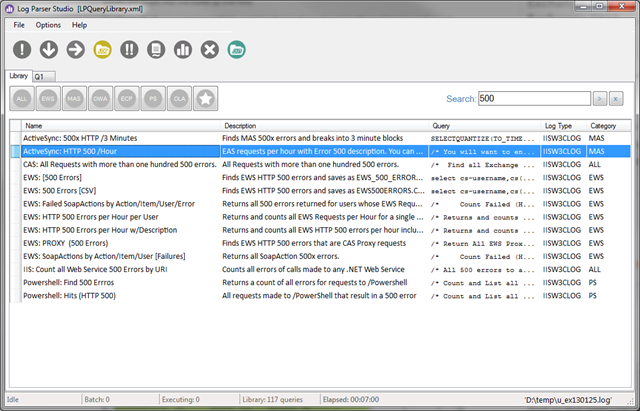
When you just started it library of different queries is shown to you along with possibility to search among them. So you have a great starting point for your custom queries.
For example here is simple query I just used:
I have found this page to be extremely useful as reference for functions in LogParser.
Be aware that LogParser doesn’t support everything available in SQL. When I tried to write something bit more complex like distinct count with grouping it complained. At least LogParser provided meaningful explanation so I knew that feature isn’t implemented. I had to use temporary file to achieve what I wanted.
Third (if you want more from IIS). Install Advanced Logging
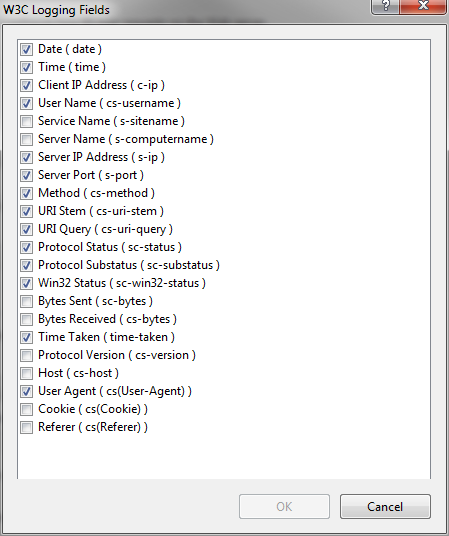
You might be in situation when default logging fields are not enough for you:
For example, some token information is supplied in http header. No worries – Install IIS Advanced Logging extension. Now you look for this pictogram:
Setup and configuration is somewhat more complex.
Here is great step-by-step with pictures: http://www.iis.net/learn/extensions/advanced-logging-module/advanced-logging-for-iis-custom-logging
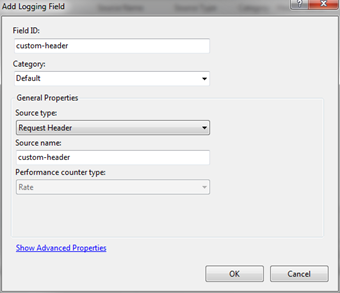
And here is mine shorter example. Say you want to include custom http request header:
- "Add Log Definition…”
- Configure it and include few common logging fields and save
- Navigate back to “Advanced Logging”, select your definition and hit “Edit Logging Fields…”
- Add logging field:

- Use it in your definition
- Enable your definition for web site (if not yet enabled)
There you go. At this moment you can analyse even more information with Log Parser or nice Log Parser Studio.
Hope this post is of help for those who want to know more about their application!
Quick links:
One comment
| Markdown | Result |
|---|---|
| *text* | text |
| **text** | text |
| ***text*** | text |
| `code` | code |
| ~~~ more code ~~~~ |
more code |
| [Link](https://www.example.com) | Link |
| * Listitem |
|
| > Quote | Quote |


Yes, LogParser is very powerful tool for working with logging information. There is also another GUI wrapper (with some additional functionality) called LIZARD GUI — read more at Scott Hanselman's article (http://www.hanselman.com/blog/AnalyzeYourWebServerDataAndBeEmpoweredWithLogParserAndLogParserLizardGUI.aspx).